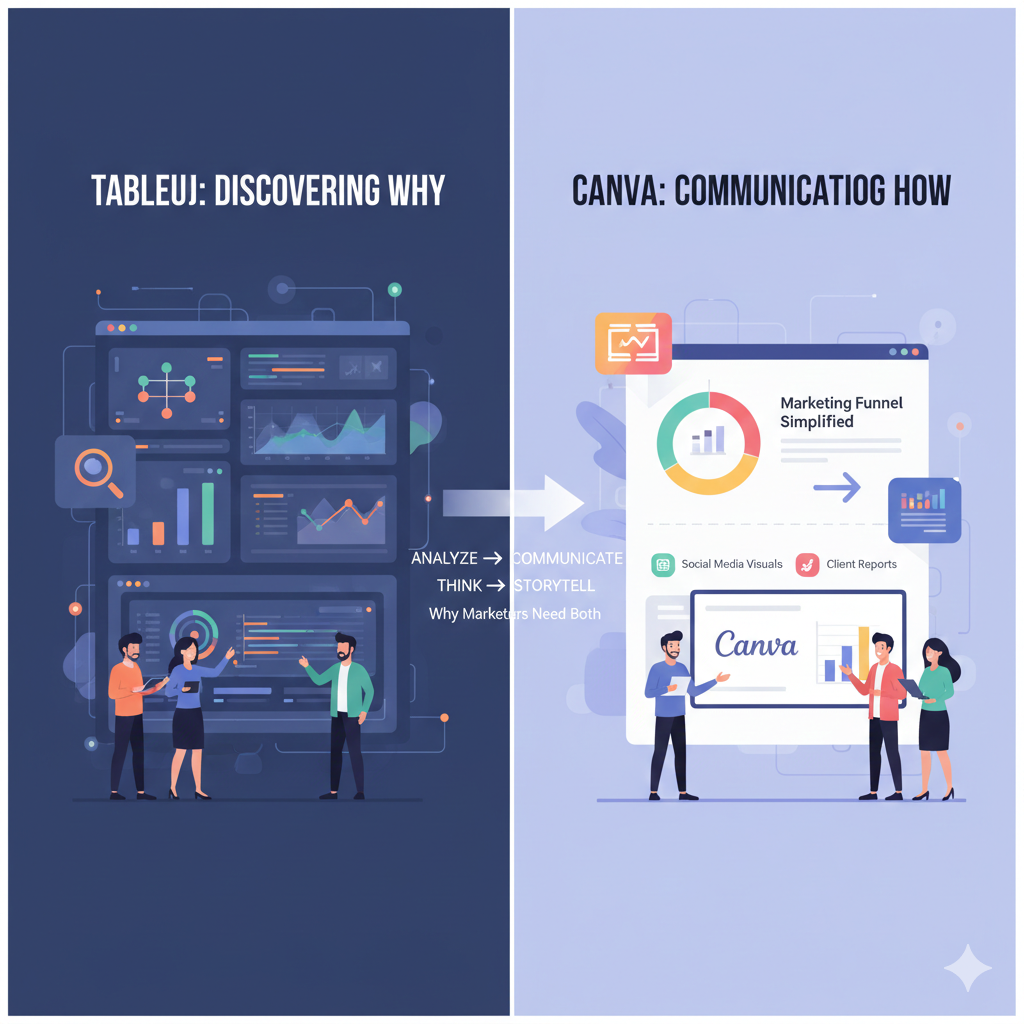
Data visualization plays a big role in how marketing insights are understood and acted upon. While a lot of tools claim to visualize data, not all visualizations serve the same purpose. Two very commonly used platforms like Tableau and Canva offer very different strengths. Understanding what each of these tools can and cannot do will help the marketers understand and communicate more effectively with different audiences.
What Tableau Is Best At
Tableau is a powerful data visualization and analytics platform that is designed to explore, analyze and explain complex datasets. It excels when there is insight discovery rather than a presentation polish.
When using Tableau Marketers can:
- Analyze big datasets from multiple sources
- Create dashboards are interesting
- Identify trends, correlations and outliers
- Allow stakeholders to filter and explore the data on their own
When it comes to marketing Tableau is especially useful for internal audiences like executives or analysts. For example, performance dashboards tracking campaign ROI, customer segmentation or even funnel drop offs will benefit from Tableau analytical depth. According to author Scott Berinato’s visualization framework, Tableau often supports exploratory or analytical visualizations, where the goal at the end is to uncover meaning instead of simply displaying it.
What is Canva Best At:
Canva, on the other hand, is a design tool built for quick , clear communication. It is ideal for transforming already known insights into visually appealing and easily digestible content.
Canva works best when marketers need to:
- Create simple infographics
- Present high level insights
- Design Social Media visuals
- Communicate findings to a non technical audiences
Instead of discovering insights, Canva focuses on storytelling and clarity. A marketer might want to use this tool to summarize Tableau finding into a one page infographic for clients, social media followers or even presentations. These visuals are usually static and simplified, but they are very effective for awareness and engagement.
Key Differences in Marketing Use
The biggest difference between Tableau and Canva is found in the intent. Tableau will answer the “ What is happening and why?” Canva will answer the “ How do we explain this clearly and attractively?”
Tableau prioritizes depth accuracy and the interaction. Canva prioritizes speed, accessibility and visual appeal. Using Canva to replace Tableau would oversimplify complex data while using Tableau where Canva shines can overwhelm the audience at the end.
Why Marketers Need to use Both:
Having a strong marketing communication beginning is by often realizing that you will need both tools in sequence. Tableau will help you think; Canva helps communicate the message. When they are used together, they bridge the gap between data analysis and story telling to ensure insights are not only discovered but also understood.
Some of the takeaways are that having effective communication is not about using the most advanced tool out there, but the most appropriate one. By aligning the tool with the audience and communication goal, marketers can turn raw data into a meaningful story that drives decisions.
No responses yet